Year highlights
Firstly, a massive thank you to all of you who trusted us with your hard earned capital during the year. It is a responsibility that we never take for granted.
For our investors and ourselves, the 2021 financial year (FY21) was very successful. The Affluence LIC Fund produced a total return of 43.2%, and the Affluence Investment Fund produced a total return of 24.1%. In comparison, the Australian share market (the ASX200 Index) returned 27.8%, so it was an astounding year all round.
Looking at FY21 in isolation is a little misleading, as it obviously excludes the Covid-induced panic meltdown of February/March 2020. We think it is useful to extend the timeframe back a bit further and look at the 17 months from the pre-Covid market high to June 2021. This provides a snapshot of performance for the full “round trip” and encompasses recent events more fully. We have compared our two largest funds’ performance to three benchmarks for this period, including income and capital growth.
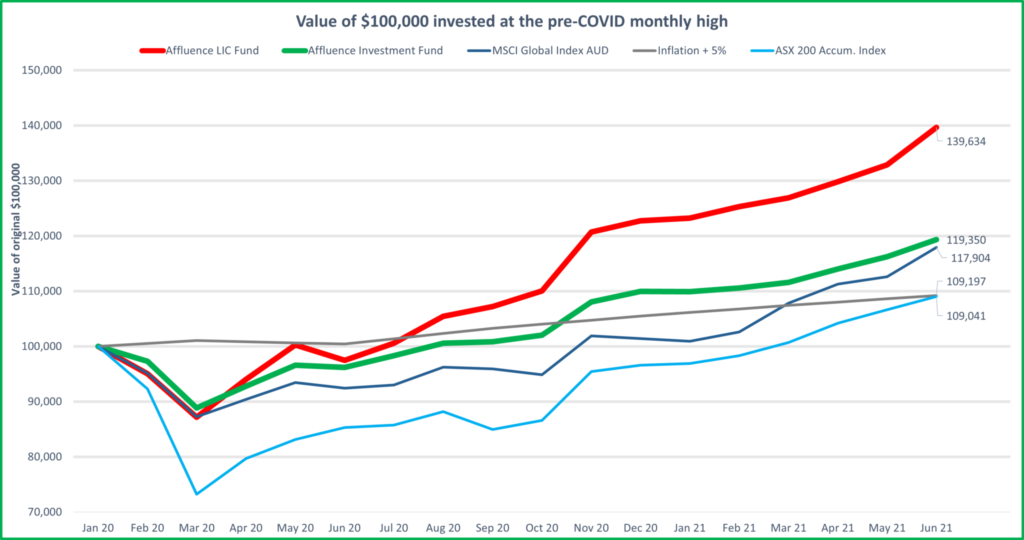
The light blue line above is the ASX200 Index (Australian equity market), which shows the dramatic sell off in February and March. The darker blue line is the MSCI Global Index (global stocks, in AUD). Finally, the grey line represents our target return for the Affluence Investment Fund, inflation plus 5%.
As you can see, both our funds significantly outperformed the ASX 200 in February and March 2020. This laid the foundation for the strong performance in FY21. We were then able to recover the smaller losses relatively quickly and keep up reasonably well with rising markets in FY21.
It’s worth remembering that for all our strategies, our focus is always on three things:
- Delivering better than average returns over three years and longer.
- Limiting the impact of market corrections and thus avoiding significant long term capital losses.
- Providing a decent level of regular income, with the option to reinvest and compound returns.
We achieved those aims in FY21, and we will continue to strive to achieve them in FY22 and beyond.
Current market
Regardless of country or asset class, the vast majority of asset prices are currently well above long term averages. For example:
- Australian and many global stock markets are at record highs.
- Commercial property yields are at or near record lows.
- Residential property prices are surging and at record highs.
- Returns on bank deposits are almost non-existent.
The main reasons behind this are extremely low or even negative interest rates, coupled with money printing by central banks and aggressive spending by world governments. The following graph shows the yield on 10 year government bonds over the past 30 years. While they have risen slightly since bottoming in 2020, they are still incredibly low. Before the GFC, investors could receive a 6% return by holding Australian government bonds. Today, an investor will receive 1.3%. That 4.7% difference has effectively pushed up the price (and lowered the available returns) for virtually all other assets.
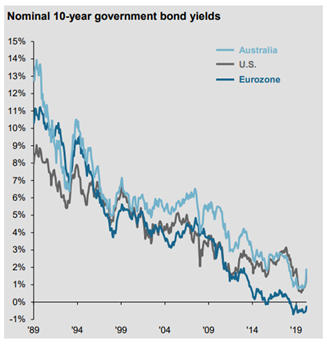
Since falling interest rates have driven up asset prices, it is fair to assume the opposite is true. If interest rates and Government bond yields were to increase (which means Government bond prices would fall), you should expect almost all other asset prices to fall as well.
One of our preferred methods of assessing the value of equity markets is comparing the current cyclically adjusted price to earnings (CAPE) ratio to long term averages. A standard PE ratio is the price of something divided by the income. The difference with a CAPE ratio is that the earnings are averaged over the preceding 10 years, adjusted for inflation. This smooths out unusually positive or negative changes in earnings from year to year.
Here are the CAPE ratios since 1981 for Australian, US and European equity markets.
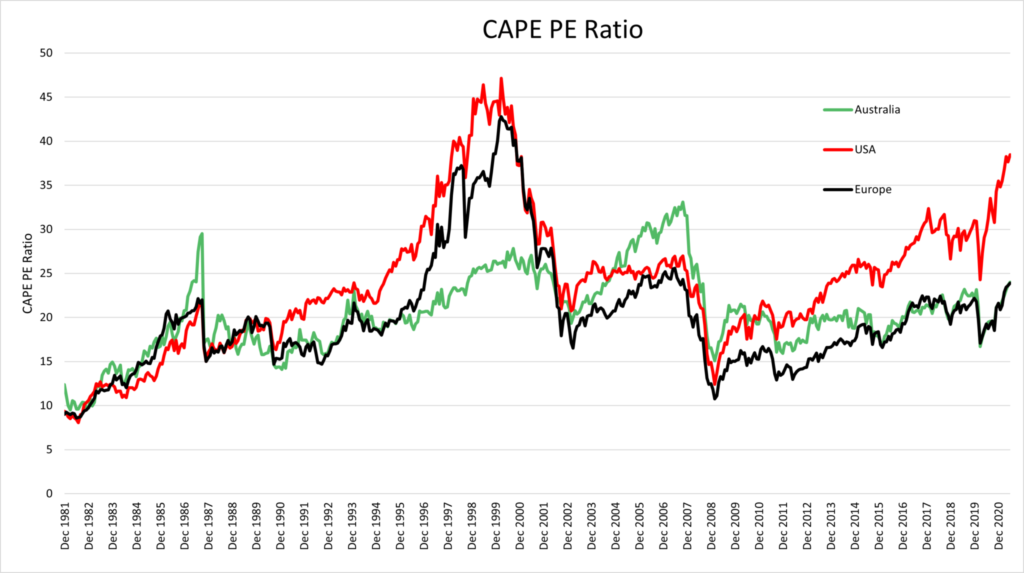
The standout on the above graph is the red line, which is the CAPE ratio for the US equity market. The last time it was this high (38) was before the 2000 tech wreck. Given our job is to find assets that are cheaper than they should be, it’s fair to say we are not big fans of the US stock market right now.
The maths of investing can be incredibly simple. One of the investment rules that has held over the long term is the higher the price you purchase an asset for today, the lower the future returns will be. The following graph from Schroders shows the average 10 year total returns from different starting valuations since 1871. It shows very clearly that the cheaper the starting CAPE, the higher the next ten years returns.
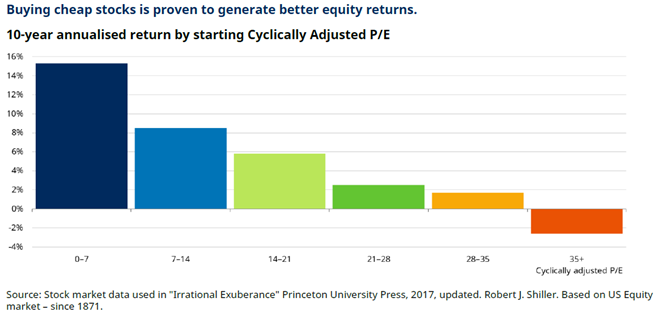
Given the current US equity market CAPE of 38, it does not present a comforting outlook. Of course, ten years is a long time, and markets have the potential to stay overvalued for extended periods. But we get paid to ensure that the risk/reward is in our favour when we invest. The US market, in general, is one of many examples of a risk we’re not willing to take.
So, in summary, based on current valuations, we believe:
- Most markets are very expensive.
- Medium to long term average returns for major market indices are expected to be poor.
That’s the bad news out of the way. We don’t set out to worry anyone unnecessarily. But we think it’s important to understand the environment in which we’re all investing. On average, it’s pretty extreme.
There is some good news. The above graphs and statistics are for market indices, not individual investments.
And no matter how expensive markets are, there are always opportunities available. We continue to find and own assets and investments that are cheaper than they should be.
There are also many strategies available to us to manage this current market risk. Each of these strategies works differently, but they all help us work towards the same investment goal. That is, to take less pain than average during any market correction and then buy assets at much lower prices. If we can do these simple things well, we will add value for our investors on both the downside and the recovery.
We believe the portfolios for all our funds strike a balance between generating returns and being prepared for the inevitable bumps along the way.
Which Fund is right for you?
We are often asked by new investors which of our funds they should invest in. We’re not allowed to give personal investment advice, so it’s a question we can’t answer directly. Instead, we prefer to deal with this issue by highlighting the expected return and risk profiles for each of our funds. It’s then up to you to decide (along with your advisor if you have one) where you allocate your investment capital. This is likely to be heavily influenced by your return expectations and your risk tolerance.
For example, the Affluence Investment Fund targets a return of inflation plus 5%. At current inflation rates, that’s around 6-7% per annum. Of course, we’ve managed to do a bit better than this so far, but nothing is ever guaranteed. In addition, this Fund aims to pay monthly distributions and perform much better than stock markets, particularly the ASX200, when markets fall. In both risk and returns, this Fund sits somewhere well above cash and bonds but below equity markets.
Conversely, the Affluence LIC Fund is targeting equity-like returns. We aim to beat the ASX200 Accumulation Index returns with less volatility. And while we have done that to date, you should assess the LIC Fund as having a similar risk/reward profile to an equity fund.
In assessing our Funds, it also helps to look at the current investment portfolio and the performance history. Below, we look at the FY21 performance and current positioning for both the Affluence Investment Fund and Affluence LIC Fund. Because the Affluence LIC Fund generally represents 15-20% of the Affluence Investment portfolio, we encourage Investment Fund unitholders to read both sections.
Affluence LIC Fund
FY21 review
The Affluence LIC Fund has now outperformed its benchmark (ASX200 Index) over all periods, with significantly lower volatility.

Discounts to NTA continued to tighten during the year. However, they are still well above “average” and what the fund experienced over its first 2-3 years. This gives us confidence that there is still further value on offer from our discount capture strategy.
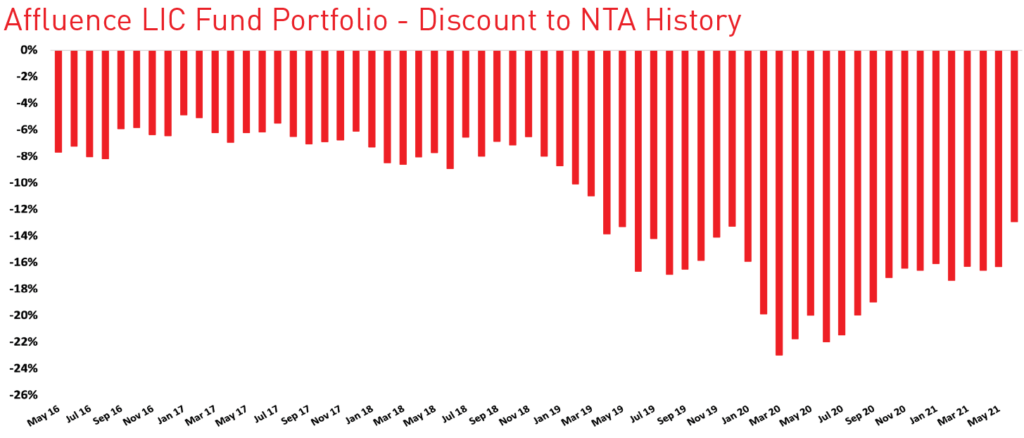
Incredibly, all our LIC investments added to performance for the 12 months, with the only negative contributors being our index hedges. Below, we look at some of the significant contributors over the year.
CD Private Equity Series
These three LITs (ASX codes CD1, CD2 and CD3) were set up to invest in US Private Equity. An experienced, wealthy US family manages the investments and co-invests alongside CD1/2/3.
The majority of the shareholders of each of these vehicles at IPO were clients of the financial planning business of the manager, Dixon Advisory, which later merged to become Evans Dixon, then Evans & Partners. The three LITs traded around their NTA for many years after listing. But when another listed Evans Dixon investment ran into trouble, clients of the financial planning business began leaving. Quite a few investors appear to have been very keen to sell any investments associated with the company. This was most certainly a case of throwing the baby out with the bathwater.
We commenced buying CD1/2/3 in the 2020 financial year. We continued to patiently increase our holdings in these vehicles throughout FY21, as this shareholder rotation continued. A combination of good underlying performance from the investments, a narrowing of the NTA discounts and some excellent distributions to shareholders from portfolio realisations resulted in returns of 70-90% for FY21.
These three LITs remain significant holdings in the portfolio, though given our views on the US market, we have hedged out some of the market risk. They continue to trade on discounts to NTA of 15-25%.
L1 Long Short Fund (LSF)
LSF might best be described as a fallen angel that recovered in FY21. LSF returned over 100% for the year. This was partly due to the discount to NTA tightening from 25% to 9%. But much more significantly, the manager, L1 Capital, delivered investment performance of 73% for the year.
LSF has been one of our largest positions all year. Coming into FY21, the manager had been through a challenging period and had significantly underperformed. This resulted in investors abandoning the LIC in droves. While the LIC was relatively new, L1 Capital had an outstanding long term track record for the same strategy. Our thesis was that this was a top tier manager that had gone through a poor period. This happens to all managers, without exception. And when it does, it often presents a tremendous opportunity. Our patience and trust resulted in an exceptional return for the LIC Fund.
Sandon Capital (SNC)
SNC returned 79% for FY21. The discount tightened from 19% to 10%, and the portfolio performance was very strong at 68%. Sandon utilise an activist strategy, whereby they try to work with investee companies to unlock shareholder value. They had some good wins during the year through a combination of activist campaigns coming to fruition and the market recovery.
Tribeca Global Natural Resources Fund (TGF)
TGF is a resource and commodities focused LIC and returned 126% for the 12 months. This was mostly a case of recovery, though. TGF listed at $2.50 in October 2018. Through some poor risk management decisions by the manager and the discount blowing out, TGF fell to less than $0.90 during early 2020. The share price recovered to $2.35 by 30 June 2021, through a very strong period of portfolio performance.
A word about hedging
Our hedging activities were the only major negative contributor for the year. Normally, the level of losses on hedges that we endured in FY21 would leave us disappointed. However, we were concerned about high market valuations for most of the year. The benefit of the hedges was that they gave us the confidence to pursue the excellent discount opportunities on offer, knowing that we had some downside protection in place if markets corrected.
In addition to our variable cash holdings, we are utilising two main types of portfolio hedging. We have used ASX200 Index Put Options for some time in the portfolio. These are best thought of as a form of insurance. We generally purchase put options with expiry dates 1-2 months in the future, at levels around 5% below current index prices. This does not provide much help in more minor pullbacks. But in larger corrections (such as in February/March 2020), they can provide significant benefits. We do not always have put options in place, and we never try to cover the entire portfolio. However, they are one tool we can use when we believe markets are expensive.
The second type of market hedge we implemented was a short ETF. We currently own several LICs that invest globally and are trading at attractive discounts to NTA. We want to own the LICs so we can benefit from the discounts closing. However, we are concerned that the value of the underlying LIC portfolios could fall if markets suffer a severe correction. A short ETF works by moving in the opposite direction to the underlying index (in this instance, the S&P 500). By hedging this way, we can retain the discount to NTA benefit while reducing much of the underlying market exposure.
Current positioning
As we discussed earlier, we are cautious regarding current equity valuation levels. We believe US equity prices to be in bubble territory. Therefore, in constructing the portfolio, we are balancing individual LIC opportunities against ensuring the portfolio can withstand a reasonable correction. We continue to hold 20-25 individual LICs in the portfolio. This allows us to take advantage of a range of opportunities while remaining reasonably diversified.
While we have had the easy wins coming out of the carnage of early 2020, the overall LIC sector is still trading at a greater than average discount. With most LICs delivering significant profits in FY21, we will likely see a raft of dividend increases and possibly even some special dividends when full year results are announced. We are encouraging all LIC managers we speak with to aim for sustainable dividend yields of 4-5% per annum, preferably paid quarterly. We know from experience that this level of dividend yield can greatly assist in reducing any NTA discount.
There has also been an increased level of corporate activity recently, which has resulted in quite a few LICs winding up, merging, or changing structures. Each of these transactions has allowed the LIC’s investors to exit at a price close to NTA. There is now plenty of pressure on those managers whose LICs continue to trade at sustained discounts to either implement strategies to reduce the discount or face the prospect of activist investors forcing them to.
LIC Fund closure
One of the most significant barriers to investment outperformance is too much money. Contrary to what the more prominent fund managers say, in investing, smaller is almost always better. We have closed the Fund to new investors, effective July 2021, to give us the best chance of continuing our good performance.
The current Fund size means we can still access the opportunities available through smaller and more illiquid LICs, which have substantially contributed to the Funds’ performance since inception. Closing the Fund to new investors preserves the remaining capacity of the Fund for existing Affluence clients. If you hold an investment in any Affluence fund, you can still apply to invest in the LIC Fund. And, of course, if you already have an investment, you can continue to add to your investment or withdraw from the Fund.
The Fund may open to admit new investors again in the future. This would most likely happen only for a short period and after a decent market correction and an expansion of NTA discounts. That is when we will be able to put significant capital to work at attractive prices.
If you are not currently an investor in the Fund and wish to be advised should the Fund open again in the future, email invest@affluencefunds.com.au with your contact details and an indication of how much you would consider investing if the Fund were reopened. You can also gain some access to the LIC strategy (as well as a whole lot of other investments) via the Affluence Investment Fund.
Affluence Investment Fund
FY21 review
The Affluence Investment Fund substantially outperformed its real return target (inflation plus 5% per annum) in FY21 and is well in front over all periods.

Most importantly, longer term returns (5 years +) are over 9% per annum, exceeding our target by over 2% per annum.
As at June 2021, the Fund continues to hold a 5 star rating from Morningstar. In addition, it was the highest returning fund in its Morningstar Category (Multisector – Flexible) over all periods.
While returns have exceeded our goals, the other factor we consider alongside our long term returns is the risk realised in achieving those returns. More particularly, how the Fund has performed at times when the ASX has fallen. The graph below shows the 10 largest monthly falls in the ASX200 Accumulation Index since the Fund commenced, and the performance of the Fund for that month. The Fund has outperformed the Index in all 10 of the worst months and delivered positive returns in 3 of them.
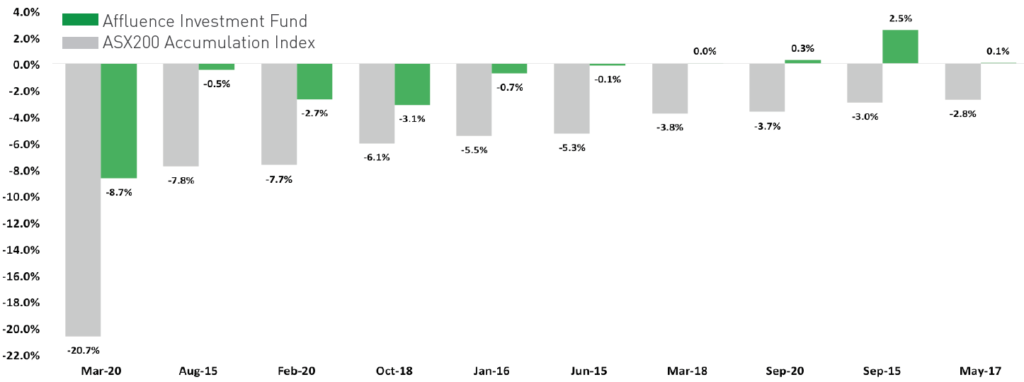
We believe that if we can substantially outperform asset markets when they suffer their biggest drawdowns, that gives us a great chance of producing better than average returns over the long run.
The following table shows the performance by asset class for FY21. In the table, you can see the contribution each asset class made to the overall Fund returns, the average portfolio allocation to that asset class during the year, and the return achieved for each asset class.
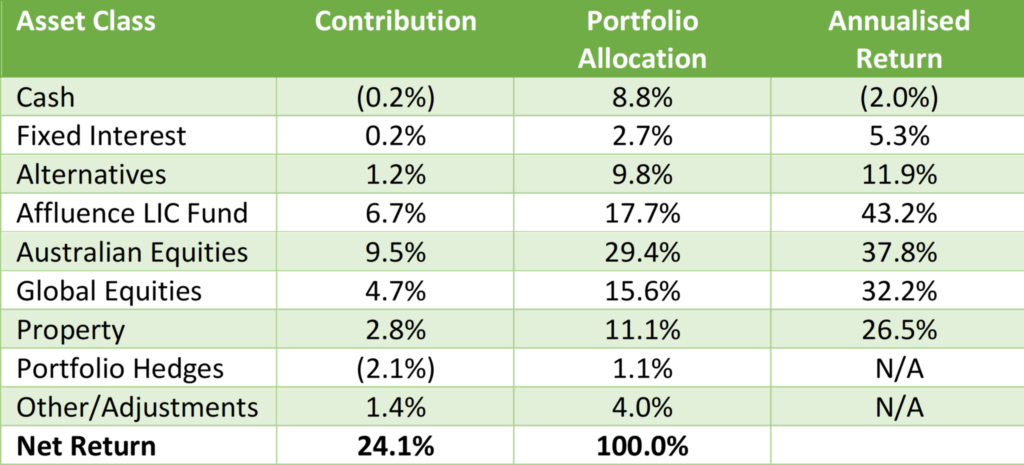
It was a very strong year across the board. As already noted, the Affluence LIC Fund delivered very good returns, as did our allocations to ASX equities, global equities, and property. Our alternatives portfolio also achieved returns well above our target. We are incredibly grateful to the wide range of underlying managers for their hard work over the past year.
Cash made a minor negative contribution, reflecting a partial cash holding in USD, which fell as the AUD rose. Our portfolio hedges cost around 2% overall, which is more than double what we would expect to incur on average. However, in a year where the Fund returned 24%, we are quite prepared to spend extra on insurance and not have to call upon it.
A reminder about strategy
The reason we started the Affluence Investment Fund was to bring together two key ideas:
- To invest with exceptional asset managers across all asset classes.
- To ensure portfolio diversification by asset class, strategy, and investment manager.
These two principles have been the cornerstone of the Affluence Investment Fund since its commencement in 2014. At 30 June 2021, the Fund was invested in 28 unlisted funds and a further 9 listed investments. We are constantly surprised by how many fantastic asset managers are available in Australia once you look beneath the surface of the dominant large (and mostly underperforming) wealth managers. Each of our managers does something different to all the others. And we continue to believe each can produce better than average risk-adjusted returns over a complete market cycle.
Also, having been running for over 6 years, the Fund now has an additional feature that sets it apart from other similar funds. Almost 40% of the underlying investments, including the Affluence LIC Fund, are closed to new investors. This means the Affluence Investment Fund now provides access to a manager set that is simply impossible to replicate. In addition, around 20% of the portfolio is allocated to funds that are only available to wholesale investors.
As with all our strategies, we focus heavily on trying to ensure the portfolio can withstand large market corrections adequately. We use four main tools to help us achieve this:
- Predominantly choosing managers who are less volatile than the market and who have a good chance of outperforming in market drawdowns.
- Portfolio diversification by asset class, investment strategy and investment style.
- The ability to carry variable cash, depending on market valuations and opportunities.
- The use of index hedges at times when we believe markets are overvalued.
Current positioning
Unfortunately, so far as we are aware, it is impossible to build a portfolio that can consistently achieve our benchmark returns (inflation plus 5% per annum) and completely eliminate periods of negative performance. Investing is always a balance between offence and defence. Our job is to ensure we strike the right balance to achieve our return target over the medium to long term. In doing this, we seek to limit the downside relative to the ASX200 and then recover those losses more quickly.
At 30 June 2021, the Fund portfolio looked like this.
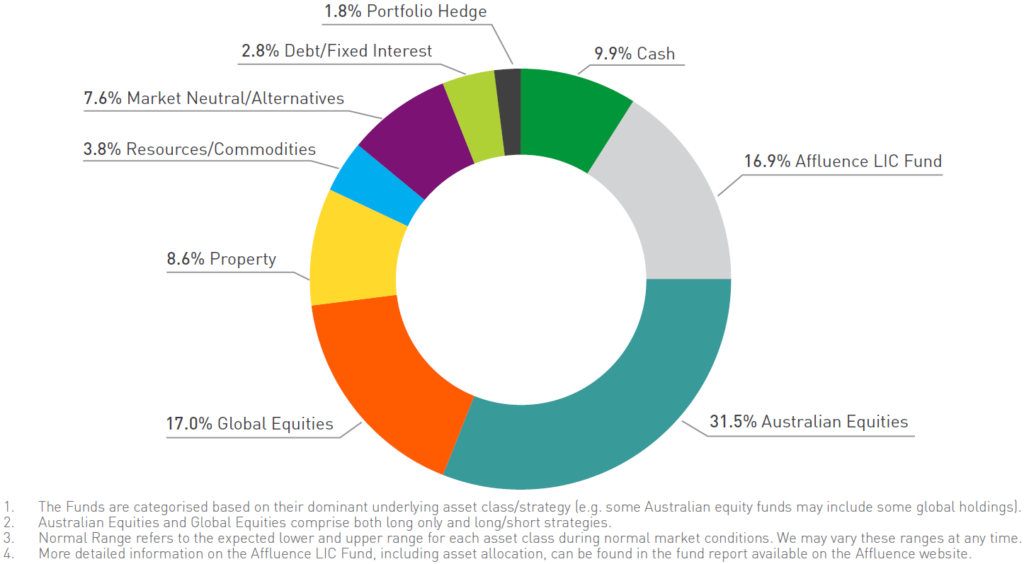
This graph categorises each underlying fund investment based on the predominant asset class. But many of our managers have discretion to invest across multiple asset classes. The Australian Equities component includes, for example, some underlying funds that invest mainly in ASX stocks, but where the manager may also invest in global equities.
Within the portfolio allocation, there are also some distinct tilts within each of the asset classes that you should be aware of:
- Our Australian equities portfolio includes an above average allocation to a range of value focused small cap managers. Australian small cap value strategies have by far the most exciting return prospects for us right now.
- The global equities sector is almost exclusively made up of long/short or value focused managers. Many of these have exposures to unloved and undervalued stocks. We’ve also got a small allocation to emerging markets, where we continue to see the prospect for good returns in a recovering global economy.
- Our property allocation was much higher earlier in the year, as we bought a range of listed REITs at prices well below the value of their assets. While we’ve now sold quite a chunk of those, we retain a small number and will be ready to buy more should markets correct.
- Our alternatives portfolio includes allocations to several managers that are either market neutral or where returns are not dependent on equity markets. We expect to increase this part of the portfolio in the coming months.
- Our direct resource/commodity exposures are just under 4% and include exposure to global gold miners and small cap resources players. We also have a reasonable amount of indirect resources exposure, including oil, uranium, and copper, through other funds. Many of these have exciting return prospects.
In addition to the almost 30 different underlying managers in the portfolio, we continue to identify new managers that excite us. While the level of turnover in underlying funds is not high, you should expect us to continue to gradually tweak the investments as markets change and opportunities come and go.
All of this means that despite our view that most asset markets, on average, range from overvalued to outright bubbles, we’ve still managed to put together a portfolio that allows us to feel very optimistic about return prospects. It also gives us the comfort of knowing your (and our) investment capital is in the hands of nearly 30 different investment teams. We trust them not only to deliver good long term results but also to do the right thing by their investors. After all, almost all of them, like us, are long term investors in the funds they manage.
Thank you for your support in FY21. We love what we do, and we look forward to continuing our search for exciting investment opportunities in the coming years.
If you found that helpful, here are some other things you might like.
See more of our articles.
Visit the Affluence Members page to see more Fund Manager and LIC profiles.
Find out about our Funds.


