Market Returns
For the 12 months to 30 June 2024, most equity markets delivered reasonable to exceptional returns. US mega caps were the standout, with the 10 largest stocks in the S&P500 delivering an annual return of a staggering 40%. In what has been a continuing trend worldwide, the smaller the stock, the more it has lagged the market.
Markets fell for the first four months of the financial year as medium and long term interest rate fears pushed markets down. However, from October 2023 onwards it has been fairly one way traffic upwards as markets climbed the wall of worry regarding inflation, central banks and recession fears.
Economic data, especially for the US but also globally, has continued to be stronger than expected. Central banks have so far been successful in trying to slowly and gradually increase unemployment to slow inflation, while not pushing the economy into recession. The US Federal Reserve is now widely expected to start cutting rates later this year, while the picture is less clear in Australia as it appears our RBA may pay the price for not increasing rates as much as their global peers.
The major themes for FY24 were as follows:
- US equities led the way, despite being very expensive to start with.
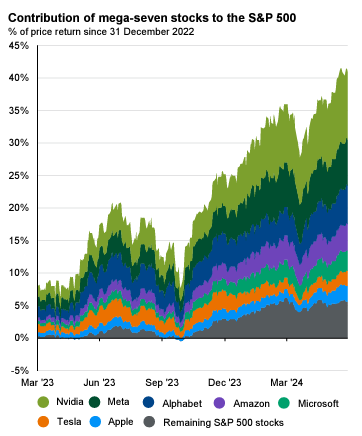
- The Magnificent 7 accounted for the vast majority of returns for the S&P 500.
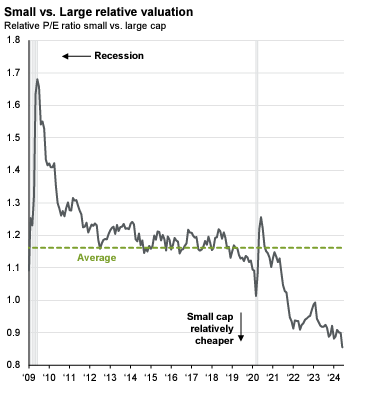
- Within Australia and globally large cap equities continued to significantly outperform small and micro cap equities, regardless of fundamentals.
- Growth stocks continued to significantly outperform value stocks, regardless of valuation.
- Strong demand for fixed income and credit drove spreads tighter across the board.
- Commercial property transactions increased, and in general values continue to decrease and reset to a new normal interest rate environment.
The following table summarises the 12 month returns for the major markets.
| Index | Sector | FY24 Return |
| ASX 200 Index | Australian large cap equities | 12.1% |
| ASX Small Ords | Australian mid/small cap equities | 9.34% |
| ASX Emerging Companies | Australian microcap equities | 5.29% |
| S&P 500 (USD) | US Shares in USD | 24.56% |
| MSCI World ex-Australia | Global shares in AUD | 19.92% |
| MSCI World ex-Australia Small Cap Index | Small cap global shares in AUD | 8.81% |
| MSCI Emerging Markets Index | Emerging markets in AUD | 12.18% |
Market Valuations
CAPE Ratios
Not surprisingly, US equities remain very expensive on most measures. The following graph compares the current CAPE ratio (similar to a PE ratio) for the major equity markets. The current CAPE is red, the average of the last 40 years is black. The blue area covers one standard deviation above and below the average and the grey indicates the extreme highs and lows.
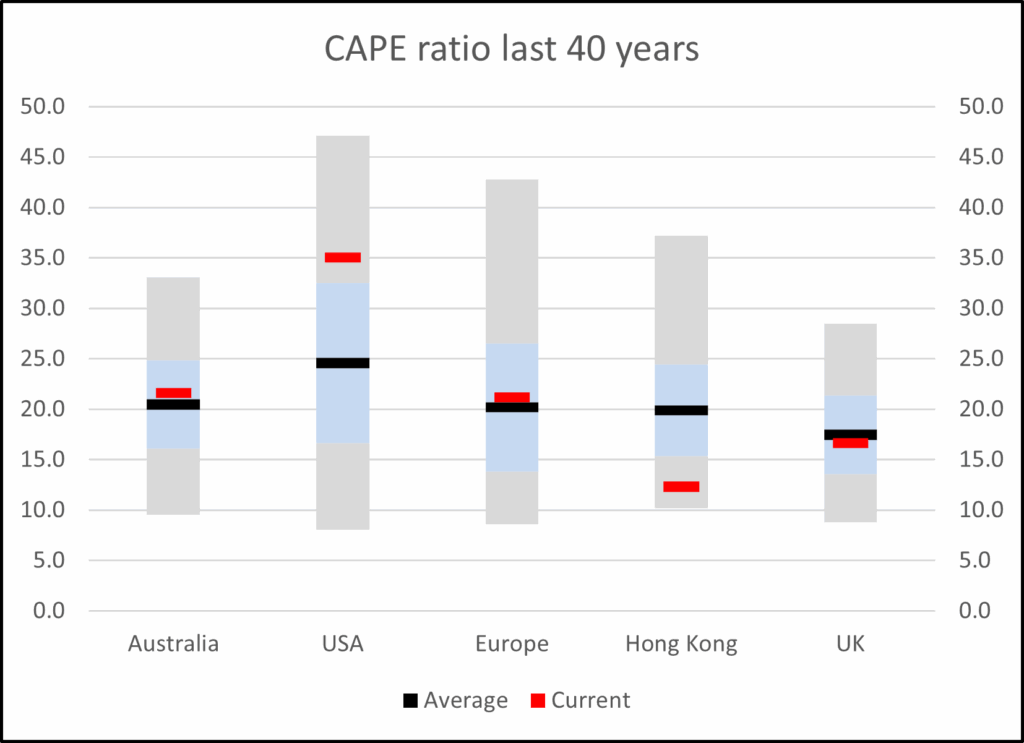
We classify the valuation of US equities as excessive. However, many would disagree. Australia is close to its long term average, as are most other markets. Hong Kong and China are significantly cheaper than usual.
While averages are interesting, that doesn’t tell the whole story. You can always find cheap investments in an expensive market. There’s just less than normal. What is a little unusual right now is the wide disparity between individual stocks. The gap between the most expensive stocks and the cheapest, is as wide as we can remember.
Australian Equities
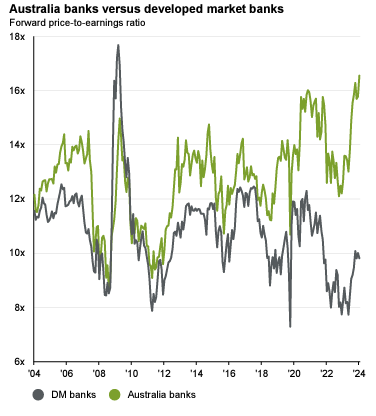
In Australia, the big four banks now make up 22% of the ASX200 Index, and the big three iron ore miners a further 13%. That’s 35% in six stocks, but only two industries. Australian banks are currently the most expensive valuation they have been for a long time (see chart below), even though future earnings are expected to be relatively flat. We are wary of the iron ore price, given the slowdown in the Chinese economy and the excessive profit margins at the current price. We have limited exposure to the ASX200 Index through our portfolios, as we believe there is far superior value outside of the largest stocks.
Excessive Concentration
CBA accounted for approximately one third of the total returns of the ASX200 Index for the last year. It is currently at record highs and one of the most expensive banks in the world. Many brokers have a sell recommendation on the stock, yet it continues to go up.
US Equities
The US is no different. The following graph shows the contribution of the Magnificent 7 stocks to the total S&P 500 return since 31 December 2022. The small grey slice at the bottom of the graph shows the remaining 493 stocks, compared to the 7 that have captured the market’s imagination.
Large vs Small
The following from JP Morgan shows the continuing and growing outperformance of large versus small equities globally. The pattern is the same here in Australia. The smaller the company, the greater the underperformance.
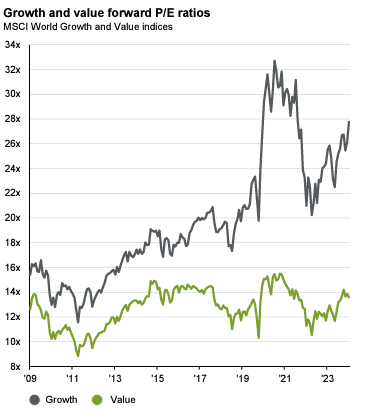
Growth vs Value
The valuation extreme between growth and value companies is as large as it has been in a long time. While value stock multiples have been fairly stable, growth stock multiples have continued to grow, despite much higher interest rates.
Opportunities
The opportunities we see are largely the same ones we discussed in our 2023 investor letter. In fact, given our description of markets above, the valuation of most assets we like has improved even further in the past year. We remain very comfortable with all our fund portfolios, which have a lot of embedded value that has the potential to deliver above average returns over the next few years.
Fixed Income
Most fixed income investments have benefited from the RBA increasing the cash rate from 0.10% to 4.35%. It is now possible to construct a diversified portfolio that yields 7-8%, with substantially less risk than equities. In FY24, we launched our first new fund since 2016, the Affluence Income Trust, to take advantage of the returns available in fixed income. We believe that interest rates will continue to be higher for longer and that the days of near zero interest rates are far behind us. If we’re right, the returns available from fixed income will remain attractive for years to come.
Small Cap Equities
In general, the smaller the company, the more it is being ignored by the market. While this is the case in most market conditions, currently this phenomenon has gone to extremes. The performance gap between large caps and small caps is at historical limits. From here, we expect small and microcap stocks to deliver very attractive returns over the medium term and to significantly outperform large caps. Just as importantly, for many small cap companies, no PE re-rating is required to drive a decent return. When you can buy good companies at 8-10 times earnings, even with very little growth, they are delivering earnings yields of 10 – 12.5% per annum, even if they’re not growing. At all. Compared to larger companies with 20+ times earnings, they look exceptionally attractive.
Listed Investment Companies
Investors continue to shun LICs. As a result, the discounts available are amongst the highest in history. Part of the reason is the popularity of Exchange Traded Managed Funds (ETMFs), which have the benefit of being bought and sold on the ASX like an LIC, without the discount. Given the large discounts on offer, there has been an increase in activist investors taking positions in the sector, which is likely to result in a number of forced capital events, which should result in strong returns for investors.
Real Estate Investment Trusts
Many REITS have recovered from cyclical lows to some degree over the last few months. But they remain well down over the past two years. There continue to be some excellent individual opportunities, particularly in the small and medium sized REITs. We recently booked some strong gains from an office REIT that has been gradually selling down its remaining properties and we hold a number of others that look particularly good value.
Resources
This is more of a medium-term opportunity. If a global recession does occur, resources are likely to be punished. But we believe that many commodities are going to experience a fundamental supply shortfall. Over time, that will be reflected in the valuation of resources companies. While BHP and Rio look expensive to us, there are a wide range of small to medium resource companies trading on very attractive multiples. In time, many of these smaller players are likely to be takeover targets for the larger players.
Investment performance
For all our funds, our focus is always on three things:
- Delivering better than average returns over three years and longer.
- Limiting the impact of market corrections and thus avoiding significant long term capital losses.
- Providing a decent level of regular income, with the option to reinvest and compound returns.
The table below summarises the performance of our three retail Affluence Funds over their lifetime.
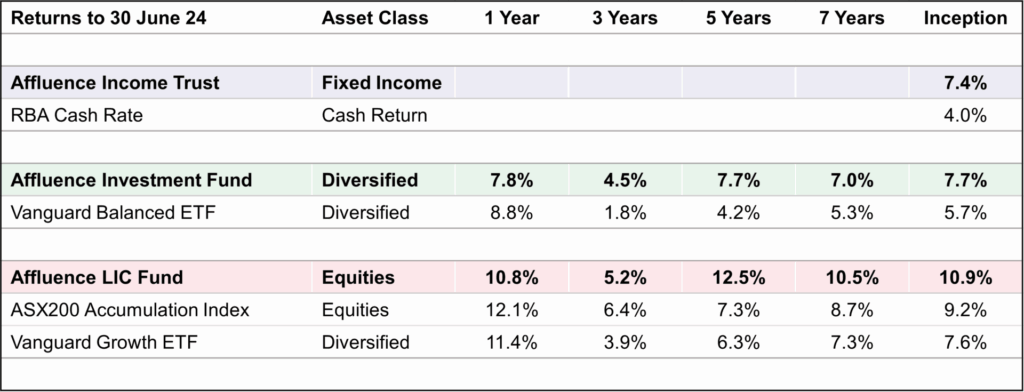
Our longer-term returns compare very well with passive alternatives. More importantly, we are much more excited about the value embedded in our fund portfolios, compared to the markets in general. This provides us with an excellent starting point for the medium term.
Affluence LIC Fund
Performance
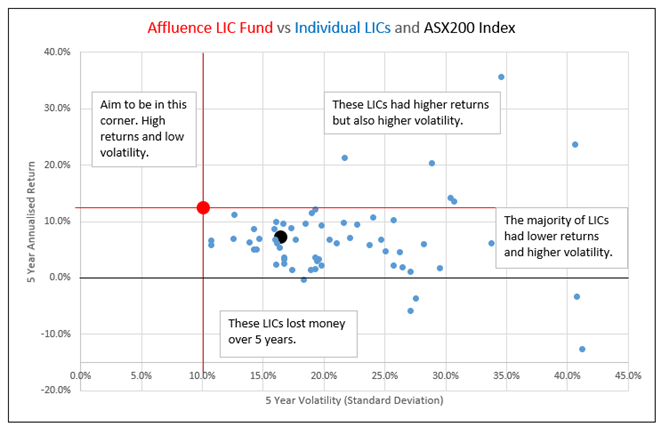
The Affluence LIC Fund has outperformed its benchmark (the ASX200 Index) over five years and longer, with significantly lower volatility.

For FY24, the Fund returned 10.8%, compared to 12.1% for the ASX200 Index. The significant increase in discounts to NTA throughout the year explains the gap. The average discount to NTA for the portfolio increased from 19% at 30 June 2023 to 25% at 30 June 2024. The increase over three years has been starker, with the average discount to NTA for the portfolio increasing from 13% to 25%. We are pleased to have continued to provide solid returns while discounts have continued to increase.
The largest positive contributors to the FY24 returns were:
- Thorney Opportunities (TOP).
- NGE Capital (NGE).
- VGI Partners Global (VG1).
- Ryder Capital (RYD).
- Platinum Capital (PMC).
We have been able to generate these solid returns through our discount capture process. For the most part, we do not believe that buy and hold is an effective investment strategy for LICs. The following graph compares returns versus volatility over 5 years for the Affluence LIC Fund (red dot), the ASX200 Index (black dot) and the individual LICs that have a 5 year track record (blue dots).
Discounts
The Affluence LIC Fund has outperformed the ASX200 Index and the vast majority of LICs with lower volatility. There were an eclectic mix of just six LICs that outperformed the Fund over 5 years, with much higher volatility along the way.
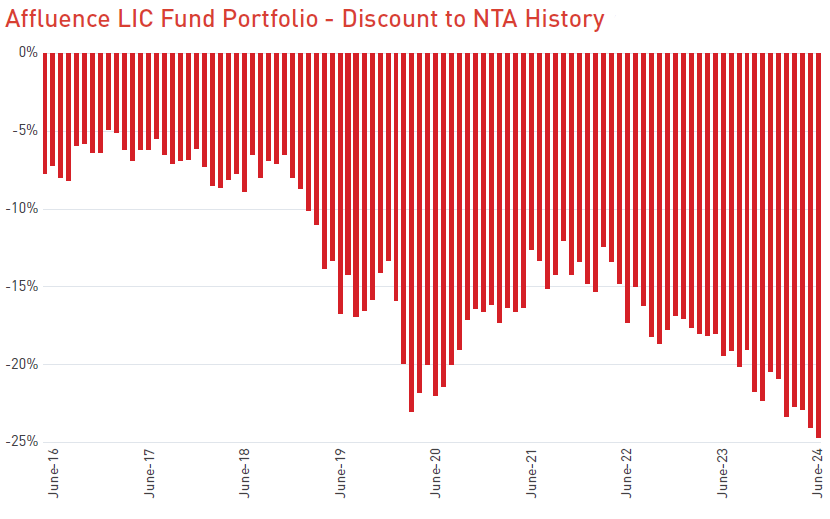
As the above chart shows, discounts have been consistently increasing from mid-2002. While this has obviously been a headwind to performance over this period, we find this incredibly exciting as we look forward.
Value add potential
There are plenty of exciting stories in the portfolio where we believe there is potential for strong gains. They fall into three areas
Strategic reviews. Several LICs have announced they are currently undertaking strategic reviews to investigate how to allow investors to sell their shares at close to NTA:
- Platinum Asia (PAI).
- Platinum Capital (PMC).
- Ryder Capital (RYD).
Activist shareholders. Several LICs have substantial shareholders (more than 5% of shares on issue) who are known to agitate for corporate action to realise value. They include:
- VGI Partners Global (VG1).
- Hearts & Minds (HM1).
- Pengana International Equities (PIA).
- Salter Brothers (SB2).
Underlying portfolio value. Many of the LICs in the fund have underlying portfolios that are demonstrably cheaper than average. A sample includes:
- Thorney Techologies (TEK).
- Acorn Capital (ACQ).
- Tribeca Global Natural Resources (TGF).
Each of these areas has the potential to deliver extra value in coming years.
Affluence LIC Fund positioning
Given the range of excellent opportunities on offer, we are fully invested. The key features of the portfolio that differentiate it from the ASX200 are as follows:
- Limited exposure to ASX 20 stocks. The portfolio has minimal exposure to the big four banks, large iron ore miners and other large cap Australian equities. We believe there are much more attractive opportunities outside this sector.
- Access to Australian small cap stocks. Small and microcap stocks have substantially underperformed larger stocks. We have continued to increase the Funds exposure to these undervalued areas.
- REITs. For the first time in the history of the Fund, it has a reasonable exposure to REITs. We have invested in a number of compelling opportunities where the securities are trading well below NTA.
- Resources. Resource equities have had a tough year. We are invested in a number of LICs that have substantial exposure to resources and resource equities.
We believe the current portfolio discount of 25% is unsustainable in the medium term. There are many LICs that are currently under pressure to deal with sustained discounts, and the continuing trend of windups, mergers and structural changes will continue to increase pressure on the remaining LICs.
We are excited about the prospects for the Fund over the next few years.
Affluence Income Trust
Performance
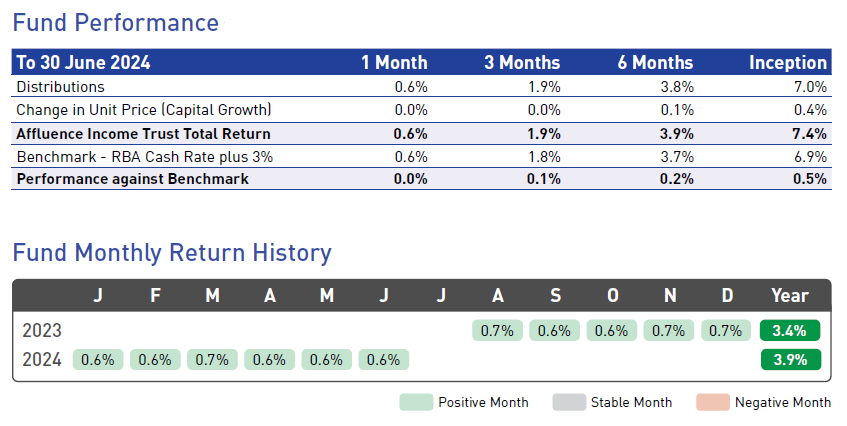
Though we made the Affluence Income Trust available for investment in January 2024, the Fund has been operating and investing since July 2023. It is focused purely on delivering attractive monthly income by investing in the fixed income asset class. Though the performance history is very short, performance for the 11 months to June 2024 is ahead of our goals.
Affluence Income Trust Positioning
The Fund has a very flexible investment mandate within the fixed income asset class. Importantly, this allows us to take advantage of what we believe to be the best risk adjusted investment opportunities within this asset class at any given time. This is very rare in the fixed income sector, with most funds constrained to investing in a single sub sector.
The Fund portfolio currently includes a range of investments chosen by us, including access to many exceptional fixed income specialists normally only directly available to wholesale and institutional clients. For most individual investors, it would be very difficult to build such a diversified portfolio of fixed income assets.
At 30 June 2024 the Fund had exposure to 16 different investments across a wide range of sub-sectors, with approximately 50% by value invested in funds that are only available to wholesale and institutional investors. The look through diversification of the portfolio was as follows:
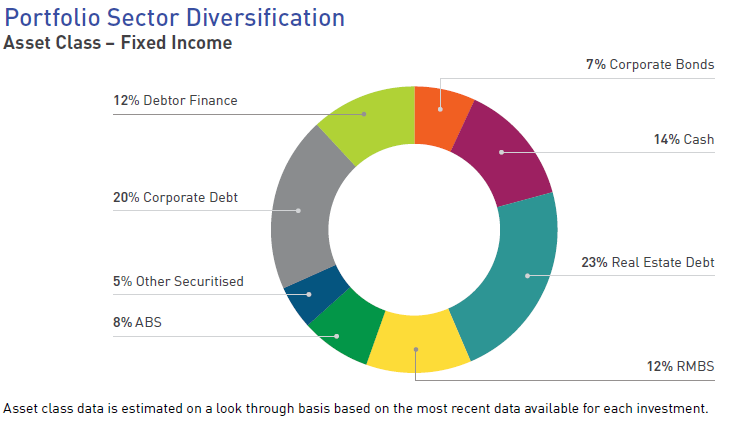
Examples of the types of investments in the Fund include:
- Commercial Real Estate Debt. Investments that derive their returns from lending to real estate borrowers. The type of assets borrowed against include office and industrial buildings, shopping centres, undeveloped land, construction projects and farmland.
- Private Credit Loans. Investments that derive returns from lending to corporate borrowers. The borrowers are typically too small to access the listed corporate debt markets, and with banks reducing their lending appetite, specialist private credit lenders are filling the void.
- Asset backed securities. RMBS and ABS loans are securitised facilities where thousands of individual loans are bundled together. The major banks typically finance the largest highly rated tranches, while specialist asset managers invest in the subordinated tranches.
- Traded debt securities. These investments are usually debt securities issued by either governments or major corporate borrowers and are liquid and highly traded.
We are excited by the depth and breadth of opportunities available in the fixed income sector. For as long as the cash rate stays at or around current levels, very attractive returns are possible with reasonably low risk.
After pretty much avoiding the sector entirely while interest rates were extremely low, we now expect fixed income to be a key source of attractive risk adjusted returns for some time.
Affluence Investment Fund
Performance
The Affluence Investment Fund had a reasonable FY24, returning 7.8%. While the Fund underperformed the passive alternative over 12 months, it remains well in front over the suggested minimum investment period of 3 years and longer. We believe the current portfolio shows significantly more potential than historic returns would suggest.

Some readers may have noticed that we have started including the Vanguard Balanced Index Fund in our Performance table. We are not changing from our official benchmark (inflation plus 5% over rolling 3 year periods). However, you can’t “invest” in that benchmark and we wanted to also include a passive investment alternative, as a way of comparing an investment in the Fund to a low cost alternative with a similar risk profile.
Affluence Investment Fund Positioning
It is impossible to build a portfolio that can navigate market downturns and then keep up with aggressive market rallies. Investing is always a balance between offence and defence. Our job is to ensure we strike the right balance to achieve our return target over the medium to long term. In doing this, we seek to limit the downside relative to the major asset markets and then recover those losses more quickly.
At 30 June 2024, the Fund portfolio looked like this.
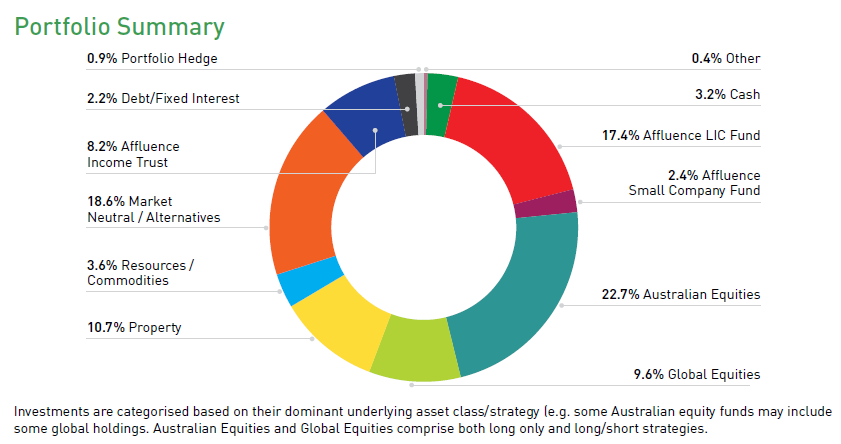
We see value in all the areas discussed above. Importantly, this fund provides investors with access to each of our three specialist funds, along with many other boutique managers. Many of the underlying managers are closed to new investors, meaning they are not able to be accessed directly.
In essence, the Affluence Investment Fund provides a combination of all our best ideas and exceptional diversification. In coming periods, we expect the Fund to benefit from its exposure to LICs, small-cap equities, property and fixed income, along with a raft of differentiated strategies with the potential to make money in differing market conditions.
More reading
Thank you to all of you who trusted us with your hard earned capital during the year. It is a responsibility that we never take for granted. We look forward to continuing our search for exciting investment opportunities in the coming years.
If you would like to read about some of our funds in more detail, here’s some additional reading:
- You can read more about the opportunity in fixed income here.
- You can read more about the current LIC market and why we like it here.
If you found that helpful, here are some other things you might like.
See more of our articles.
Visit the Affluence Members page to see Fund portfolios and download our guides.
Find out about our Funds.


