
Hi,
All three Affluence funds preserved capital in February, when the ASX 200 Index fell by 2.4%. Detailed fund reports can be accessed below.
We’re also pleased to advise that both the Affluence Investment Fund and Affluence LIC Fund are now available via the Netwealth Platform. Contact us to find out more.
The big news in the last few days has been the collapse of not one, but two US banks. While the regulators have stepped in to ensure account holders’ funds are safe, it’s probably not the last problem we will face as a result of the speed of interest rate rises over the past 12 months. Below, we look at the collapse of SVB and other things we found interesting this month, including how Aussie banks are different from their US counterparts, the Salt March, radioactive diaries and why the iPhone almost didn’t get built.
Monthly applications for the Affluence Investment Fund and Affluence Small Company Fund close on Friday 24 March. Applications for the Affluence LIC Fund close Friday 31 March. Go to our website and click “Invest Now” to apply online or access application and other forms for any of our funds.
If you have any questions or want to give us some feedback, reply to this email or give us a call.
Regards,
Daryl, Greg and the Affluence Team.
Affluence Fund Reports
Affluence Investment Fund
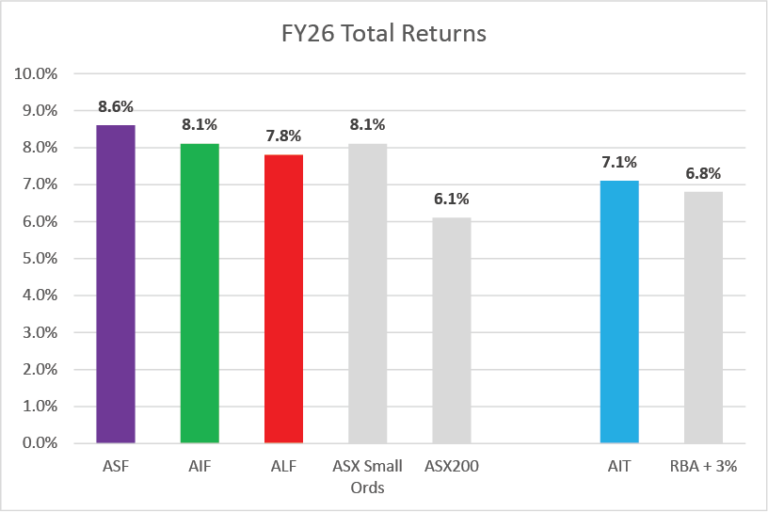
The Affluence Investment Fund increased by 0.1% in February. Since commencing over eight years ago in November 2014, the Fund has returned 7.9% per annum, including monthly distributions of 6.5% per annum.
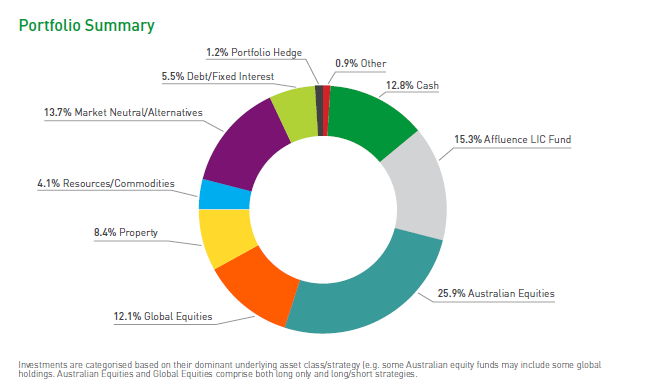
At month end, 61% of the portfolio was invested in unlisted funds, 15% in the Affluence LIC Fund, 10% in listed investments, 1% in portfolio hedges and 13% in cash.
The cut-off for monthly applications and withdrawals is Friday 24 March.
Affluence LIC Fund
The Affluence LIC Fund decreased by 0.1% in February, as the ASX 200 fell by 2.4%. Since the Fund commenced over 6 years ago, returns have averaged 11.6% per annum, including quarterly distributions of 8.0% per annum.
The average discount to NTA for the portfolio at the end of the month was approximately 17%. The Fund held investments in 28 LICs (66% of the Fund), 3% in portfolio hedges and 31% in cash.
The cut-off for monthly applications and withdrawals is Friday 31 March.
Affluence Small Company Fund
The Affluence Small Company Fund increased by 0.3% in February, as the ASX Small Ords fell by 3.7%. Since commencing in 2016, returns have averaged 9.3% per annum.
The Fund held 8 unlisted funds (58% of the portfolio), 8 LICs (15%) and 7 ASX listed Small Companies (22%). The balance 5% was cash and hedges.
Available to wholesale investors only. The cut-off for monthly applications and withdrawals is Friday 24 March.
Invest Differently
The Affluence Investment Fund provides you with access to a wide range of different investment strategies, combining our portfolio construction expertise, with access to over 30 talented boutique investment managers. A significant number of funds in the portfolio can only be accessed directly by wholesale investors, or existing clients of the manager.
We aim for the Affluence Investment Fund portfolio to have an all weather focus – prepared for whatever markets may do. We also tend to skew the portfolio towards the asset classes that we feel are cheapest, and to the themes we think are most likely to impact markets over the next few years. Returns since the Fund commenced have been similar to the Australian share market, with more consistency and significantly better outcomes in falling markets.
With monthly distributions and a performance based fee structure, the Affluence Investment Fund may be a useful diversifier for your investment portfolio.
Things we found interesting
Chart of the month: SVB – why it’s important and what you need to know.
Less than one month ago, Silicon Valley Bank (SVB), was America’s 16th largest bank. It held approximately USD$170 billion in client deposits. Last Wednesday, 8 March, SVB announced an emergency capital raising, as a result of having sold over $20 billion in assets at a loss to fund customer withdrawals. The next day, customers collectively tried to withdraw a further $42 billion, and SVB literally ran out of money. The regulator took control on Friday 10 March.
By Sunday night, just 4 days after the panic set in, US regulators had devised a plan to effectively guarantee all customer deposits. So SVB account holders will ultimately suffer no loss. Regulators also plan to make a facility available to act as a circuit breaker against the potential for other US banks to suffer the same fate, following the failure of a second, smaller, crypto-focused bank over the weekend.
Contrary to deposit holders, owners of SVB shares and bonds will not be so lucky. It is almost certain they will lose the entirety of their investment. On Monday 13 March, Australian LIC Pengana International Equities (ASX code: PIA), announced they had held 2% of their portfolio in SVB shares, which are now likely worthless.
While the circumstances surrounding the collapse are mostly specific to SVB, one weakness is common to many other banks. Almost all financial institutions, as part of their assets, hold some bonds and other fixed-interest investments where the rate of interest they receive is set for the life of the investment, which in many cases is 5 years or more. As interest rates have risen over the past 12 months, the value of those fixed rate investments has fallen. This makes sense. If you bought a 10 year bond paying 2% per annum at the start of 2022, and the going rate for new 10 year bonds in 2023 is now 4.5% per annum, then you’re going to have a take a loss if you want to sell that shabby 2% 2022 bond in today’s market. Very simply, that old 2022 10 year bond is paying 2.5% less than the current market for the remaining 9 years of it’s life. So today’s buyer is going to want to pay about 22.5% less for it now (2.5% pa x 9 years of remaining term). The chart below shows the impact of this on US banks. It shows the difference between US bank fixed interest investments’ original cost and their current market value.
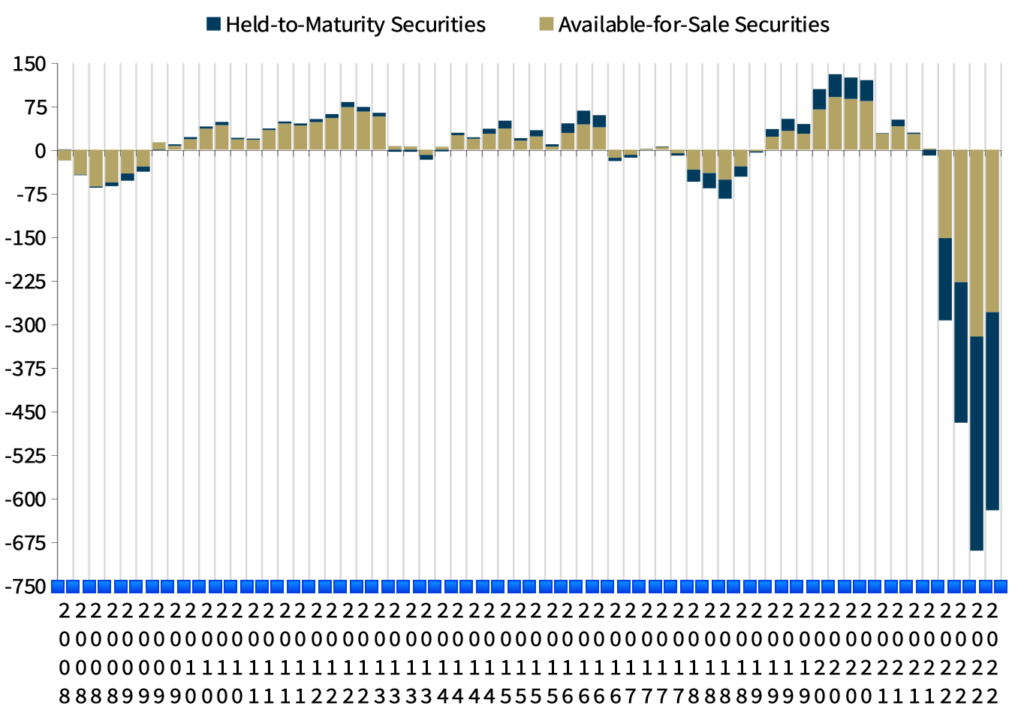
If they had to be sold today, those investments would collectively be worth around $600 billion less than their original cost. Of course, so long as the banks don’t have to sell those investments today, the losses will remain unrealised. They will just earn the original, low interest rate on them until maturity. And it will all be alright.
Incidentally, banks in Australia have quite a different risk profile. They have much less exposure to long term bonds, and much more exposure to Aussie housing. As one example, Westpac’s balance sheet at 30 September last year showed assets of just over $1 trillion. Of that, around 10% was cash, and 16% was bonds and other assets. The remaining 74% consisted of loans to Westpac customers, including 52% in residential mortgages. That’s why the key risk for Australian banks is a very substantial fall in house prices.
If you’d like to read more about SVB, and how it all unfolded so rapidly, have a look at this article by Coolabah Capital’s Chris Joye.
Chart of the month 2: Not deserting the ARKK…yet.
Cathie Wood’s Ark Investment Management has earned more than $300 million in fees on its flagship ARKK ETF since its inception nine years ago. During the same period, investors in the ETF have collectively lost almost $10 billion.
Normally, this performance would lead to investors deserting the offending fund manager in droves. But, unbelievably, since markets topped out in January 2021, investors have added another $2.7 billion to the listed ARKK fund. That makes us worry that the growth stock price reality check is not yet complete.
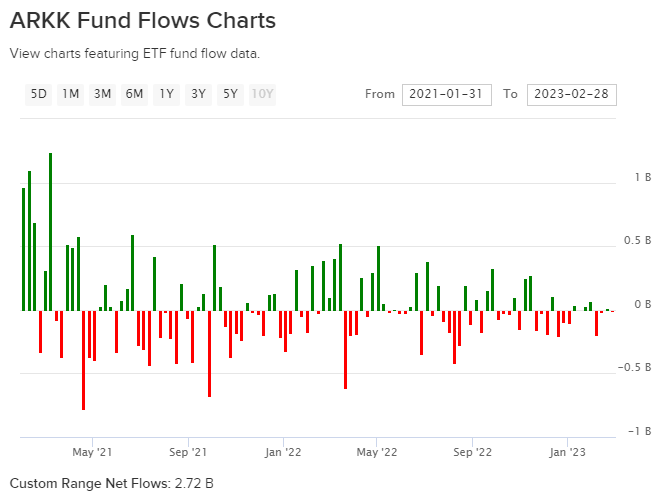
Chart of the month 3: History doesn’t repeat, but…
The chart below plots the Nasdaq tech index now vs the Dow Jones Index in the mid 1970’s.

We still believe that most tech stocks remain well above fair value. So, it would not surprise us to see the comparison remain valid.
This month in history.
In March 1930, Mahatma Gandhi began the Salt March, a 24 day nonviolent protest against the British taxing of salt. Gandhi started with 78 volunteers. The march spanned 387 kilometres, and growing numbers of Indians joined them, peaking at over 50,000 marchers. Gandhi gave interviews and wrote articles along the way. Foreign journalists and three Bombay cinema companies shooting footage, turned Gandhi into a worldwide household name. At the end of 1930, Time magazine named him “Man of the Year”.
Upon arriving at the seashore on 6 April 1930, Gandhi raised a lump of salty mud and declared, “With this, I am shaking the foundations of the British Empire.” He then boiled it in seawater, producing illegal salt. This sparked large scale acts of civil disobedience against the salt laws by millions of Indians. Gandhi was eventually arrested for his actions on 5 May 1930. Over 60,000 Indians were jailed as a result of the Salt March. The protests against the salt tax continued for almost a year, ending with Gandhi’s release from prison in 1931. Though the British did not immediately relax the salt tax, the Salt March led to the Round Table Conferences of 1930–1932, a series of peace conferences between the British Government and Indian political personalities to discuss constitutional reforms in India.
Vaguely interesting facts.
In the 1800s, composer Franz Liszt was worshipped like a rock star. He received so many requests for locks of his hair that he bought a dog and snipped off patches of its fur to send to his admirers.
Amelia Earhart and Eleanor Roosevelt once sneaked out of a White House event, commandeered an aeroplane, and went on a joyride to Baltimore.
Marie Curie is best known for her pioneering research on radioactivity. Her notebooks, which have been preserved, are still radioactive.
After inventing the telephone in 1876, Alexander Graham Bell suggested answering calls with “ahoy.” Go on, try it!
Contrary to popular myth, the iPhone was not Steve Jobs’ brainchild. Initially, he hated the idea.*
Source: mentalfloss.com, wikipedia.com.
* Steve Jobs was against building phones for two reasons. He didn’t want to depend on phone companies, which at the time could determine which phones could use their networks. And he didn’t think smartphones were going to be that popular. But his team at Apple was convinced it was the way to go, and they started work on the iPhone without his knowledge.
While they worked on it, two Apple veterans, Mike Bell and Steve Sakoman, continued to lobby Steve. They believed that computers, music players and cell phones were heading towards an inevitable convergence. In late 2004, Bell emailed Jobs: “Steve, I know you don’t want to do a phone. But here’s why we should do it. Jony Ives has some really cool designs for the future iPods that no one has seen. We ought to take one of those, put some Apple software around it, and make a phone ourselves instead of putting our stuff on other people’s phone.”
Jobs remained against it. He called Mike Bell, and they debated for hours. Finally, he relented and agreed to build a phone. And the rest, as they say, is history.
And finally…
The Berkshire Hathaway annual letter was released last month. There’s not much new in there this year. So instead, here’s Warren Buffett’s first known TV interview from 1985. The quality isn’t great (it was nearly 40 years ago), but it’s still worth watching. There are some timeless investment lessons in here.
If you enjoyed this newsletter, forward it to a friend.
If you are that friend, you can subscribe and see previous newsletters here.
Got a question?
If you want to learn more about our Funds or invest with us, the buttons below will take you to the right places.
If you want to catch up on earlier versions of our monthly newsletter, you can view them here.
If you have a question, you can email or call using the details below, or simply reply to this email and we will be in touch with you as soon as we can.
Our Funds Invest Now Contact Us
P: 1300 233 583 | E: invest@affluencefunds.com.au | W: affluencefunds.com.au
This information has been prepared by Affluence Funds Management Limited ABN 68 604 406 297 AFS licence no. 475940 (Affluence) as general information only. It does not purport to be complete, and it does not take into account your investment objectives, financial situation or needs. Prospective investors should consider those matters and read the Product Disclosure Statement (PDS) or Information Memorandum (IM) offering units in the relevant Affluence Fund before making an investment decision. The PDS or IM for each Affluence Fund contains important notices and disclaimers and important information about each offer.
As with all investments, an investment in any Affluence Fund is subject to risks. If these risks eventuate, they may result in a reduction in the value of your investment and/or a reduction or cessation of distributions. Distributions are not guaranteed, nor is the return of your capital. Past performance is not indicative of future performance. It is important that you know that the value of your investment will go up and down over time, returns from each Fund will vary over time, future returns may differ from past returns, and returns are not guaranteed. All of this means that you could lose money on an investment in an Affluence Fund. As set out in the PDS or IM for each Affluence Fund, key risks include concentration risk, economic and market risk, legal and regulatory risk, manager and key person risk, liquidity risk, leverage risk and currency risk. Affluence aims, where possible, to actively manage risks. However, some risks are outside our control.
This information and the information in the PDS or IM are not recommendations by Affluence or any of its officers, employees, agents or advisers. Potential investors are encouraged to obtain independent expert advice before making any investment decision.